There is an interview question I like a lot: “Walk me through serving a production model such as Kimi K3 end to end, once at production size and once with 8 GPUs.” Most answers I hear start from a familiar recipe for large Mixture-of-Experts (MoE) models. We use tensor parallelism if we care about latency, we switch to DP attention with expert parallelism if we care about throughput, and at scale we split prefill and decoding into separate servers. I described the first two for GLM-5.3 in an earlier article, and for that model, the recipe works.
For Kimi K3, the recipe needs more care, because three of K3’s numbers get in the way. First, its checkpoint takes up 1.56 TB (2.8 trillion parameters, by the SGLang team’s count), against 288 GB on a B300 GPU and 141 GB on an H200. That decides how many GPUs one copy needs. Second, 69 of its 93 layers keep no KV cache at all, only one fixed-size state per request, which decides how many requests can run at once. Third, each MoE module has 896 experts, of which a token uses 16. These experts are 93% of the checkpoint, so how we cut them across the GPUs decides every layout below.
What does a production deployment of this model look like, then? I want to answer for three sizes: one server with 8 B300 GPUs, 32 H200 GPUs in four servers, and a GB300 rack with 72 GPUs. The same few numbers decide the layout at every size, but something different runs out first each time.
I assume you know the mechanisms, because other articles in this series cover them: tensor, data, and expert parallelism, Multi-Head Latent Attention (MLA), decode context parallelism, speculative decoding, and disaggregated serving.
I don’t have the same evidence for each size:
- The deployment on 8 B300 GPUs is the one the SGLang cookbook marks as verified, and I measured it again on our machine, with real agent requests.
- The deployment on 32 H200 GPUs is one I run myself. I give its configuration and memory arithmetic, not measurements, and I compare it with what others have posted.
- The rack deployment combines a proposal for the whole rack with pieces measured on smaller systems. As far as I could find, nobody has published a K3 run that fills a GB300 rack, and I haven’t run one.
(I stick to SGLang at one commit, NVIDIA GPUs, and text requests, and leave out kernels, cost, and power.)
1. What Has to Be Served#
Before we choose a layout, we need three sizes (the weights, the state of a request, and the cache entry of a token) and one latency target.
1.1 Where the Bytes Are#
The model configuration says that K3 has 93 layers with a hidden size of 7,168 and that all layers except the first contain an MoE module. I read the headers of the checkpoint files, which list every tensor with its shape and data type. Figure 1 shows the result.
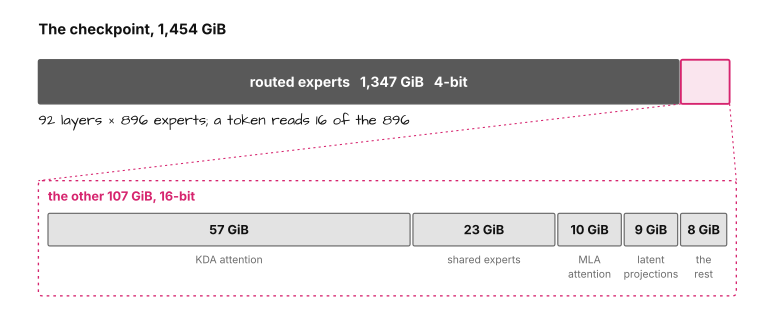
In Figure 1, the routed experts, stored in a 4-bit format, make up 93% of the checkpoint. Everything else is in 16 bits and adds up to only 107 GiB. More than half of that, 57 GiB, is the attention weights of the 69 fixed-state layers, which use Kimi Delta Attention (KDA). The 24 layers that use MLA take another 10 GiB. (MiB and GiB are powers of 1,024, GB and TB the vendors’ powers of 1,000, so nvidia-smi shows a B300 at 268.6 GiB, about 288 GB.)
Three things follow from this picture. First, almost all the memory goes to the experts, but we can cut them any way we like. Each GPU can get a slice of every expert, a subset of whole experts, or all the experts of some layers. One layer’s experts take up 14.6 GiB, and a token reads only 16 of the 896.
Second, the attention weights are small in comparison, but they get copied if every GPU runs the complete attention module for its own requests, as DP attention does. At 67 GiB (57 + 10), that copy is expensive. Third, the latent projections map between the model’s hidden size and the smaller size the experts work in. Their 9 GiB are stored in full on every GPU that holds their layer.
1.2 Two Kinds of State#
Next, let’s look at what the server has to remember for a request.
An MLA layer keeps a KV cache, as usual. For every token, it stores one latent vector with 576 values, which all attention heads read. With 24 layers and 16-bit values, a token’s cache entry costs 24 × 1,152 = 27,648 bytes. Since this vector can’t be divided by head, tensor parallelism stores it on each of its GPUs.
A KDA layer works differently. KDA is a form of linear attention, where a layer doesn’t compare a new token with all earlier ones. Instead, it folds every token into a matrix of fixed size, one 128 × 128 matrix per head, and reads the new token’s output from it. That’s why a KDA layer keeps one state per request and nothing per token.
How large is it? K3 has 96 heads and 69 KDA layers, and the matrices are stored as 32-bit floats by default, which gives 414 MiB. Together with a small buffer per layer for a convolution over the last few tokens, the state of one request takes up 429 MiB. Tensor parallelism does divide it, unlike the MLA cache, since each GPU needs only the heads it computes. On 8 GPUs, that leaves 53.6 MiB per GPU. I will call these 53.6 MiB a state block.
One complication is prefix caching, where the server reuses the beginning of a prompt that it has seen before. SGLang can’t share a state the way it shares cache entries, because a state is overwritten with every token. Instead, it keeps copies of the state at fixed positions in the prompt, from which a later request can continue. SGLang’s code budgets 5 state blocks per running request of any length, the live state and these copies (268 MiB per GPU).
Let’s take two requests we will use throughout. The fresh request is one coding-agent call, rounded to 8,500 tokens, and the long session has a round 128,000. The fresh request needs 224 MiB of cache per GPU, next to 268 MiB of state. The long session needs 3.3 GiB of cache, next to the same 268 MiB. Figure 2 shows both.
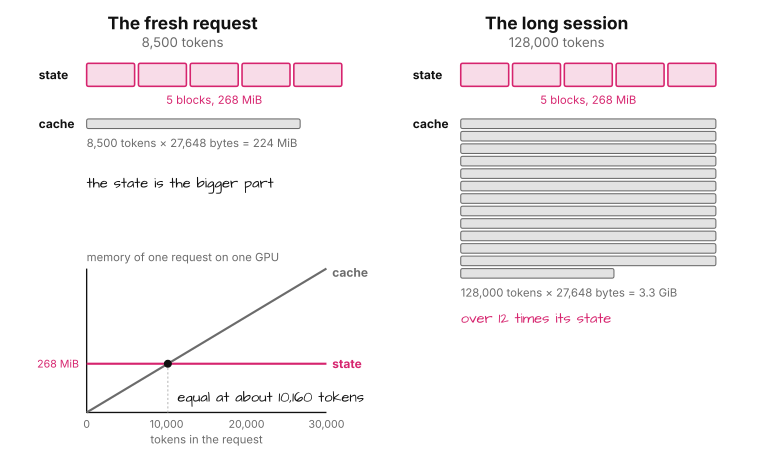
The thing to notice in Figure 2 is the crossing point at about 10,160 tokens. Below it, a request costs more state than cache, and above it, the cache dominates. A server full of short requests runs out of state blocks first, and a server full of long sessions runs out of cache first. This crossing point is what K3’s main sizing flag is about.
1.3 Two Pools and One Flag#
SGLang splits whatever is left after the weights into two pools at startup. The state pool holds state blocks. At 5 blocks per request, it limits how many requests can run at once. The cache pool holds the MLA cache entries and is handed out in pages as requests grow.
A single flag, --mamba-full-memory-ratio, sets the ratio between the two pools. The cookbook has a calculator for it, and the formula is the comparison from Figure 2. The ratio is the state that an average request needs, divided by the cache it needs.
ratio = (S + D) × state_bytes / (L × (mla_kv_bytes / DCP + draft_kv_bytes))
Here, S is the number of state blocks per request (5 by default), state_bytes is the size of one block, and L is the average length of a request in tokens. The remaining terms belong to features from section 2. D is the number of extra state blocks that speculative decoding holds, the draft term is the cache of the draft model, and DCP is the number of GPUs across which decode context parallelism divides each entry’s cost. For example, requests of 8,192 prompt and 1,024 output tokens, 9,216 in total, give a ratio of 1.1 on our 8 GPUs.
The SGLang team calls this a bet on the traffic. If requests run longer or shorter than L, one pool fills up while the other has room.
1.4 One Request and a Target#
Finally, let’s follow one request through a server. The request is rendered into K3’s chat format and tokenized. The scheduler then has to admit it, which needs free state blocks and free cache pages. After that, the prompt goes through all 93 layers in chunks of up to 16,384 tokens (prefill), and the server generates the output one step at a time (decoding).
For the measurements in section 2, I use real agent traffic from the Exgentic v2 traces, which record every model call in agent sessions, including the system prompt, the tool definitions, and the full history. From them, I built two kinds of requests:
- The fresh request: about 8,400 prompt tokens on average with K3’s tokenizer, answered with up to 512 tokens. I tagged each so that it shares no prefix with any other.
- The long session: a history of about 118,000 tokens from the same traces, followed by returning turns that each add about 2,000 tokens.
As a target, I picked what seems reasonable for an interactive agent. The first token should arrive within 2 seconds. Each stream should then run at 40 tokens per second or more, which means at most 25 ms per token on average over the request. (In our runs, about a third of the answers are tool calls that the server delivers in one piece once they are complete. Such an answer meets the target if it arrives within 2 seconds plus 25 ms per token.) To test against it, I let requests arrive at random at a fixed average rate. The sustained rate is the highest rate at which 95% of the requests still meet the target.
1.5 Summary#
To summarize, K3’s weights take up 1,454 GiB, of which 93% are 4-bit experts we can cut any way we like. A running request needs 268 MiB of state per GPU and 27,648 bytes of cache per token. One flag splits the server’s free memory into a pool for each, and the state pool limits how many requests can run.
2. Eight B300 GPUs: One Server Does Everything#
The smallest deployment is a single server with 8 B300 GPUs, for which the cookbook has two recipes it marks as verified (by a speed test, not for accuracy). I ran both on our machine with the agent requests from section 1.4.
2.1 The Layout That Fits#
With 1,454 GiB of weights and 268.6 GiB per GPU, there is room for exactly one copy of the model. The question is how to cut it. For each candidate, I computed the weights per GPU from section 1.1’s tensor list and the way SGLang divides each kind of tensor. Figure 3 shows the result.
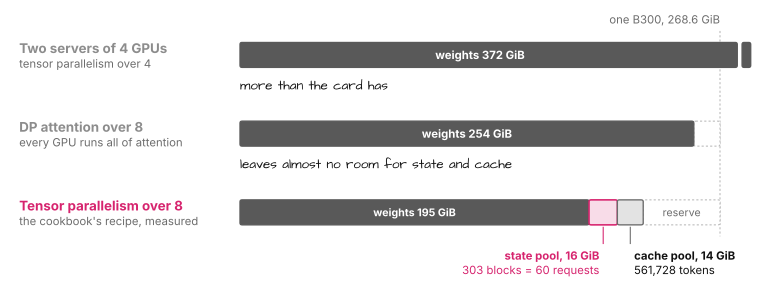
In Figure 3, tensor parallelism over all 8 GPUs gives every GPU an eighth of the experts and of the attention weights, plus the parts stored in full on every GPU. By my arithmetic, that comes to 192 GiB. The server reported 195 GiB after loading, so the arithmetic is off by less than 2%. I will rely on it for the larger deployments, which don’t fit on this machine.
The alternatives don’t leave room to serve. With only 4 GPUs per copy, each GPU would need 372 GiB. With DP attention, the 67 GiB of attention weights are copied to every GPU, and the weights grow to 254 GiB, which leaves almost nothing for state and cache.
The recipe is short:
sglang serve --model-path moonshotai/Kimi-K3 --trust-remote-code \
  --tp-size 8 --mem-fraction-static 0.85 \
  --reasoning-parser kimi_k3 --tool-call-parser kimi_k3 \
  --mamba-full-memory-ratio 1.1
SGLang chooses the rest for this model on the B300. It serves the experts in their stored 4-bit format with 8-bit activations, gives each GPU a slice of every expert, and runs the all-reduce sums that tensor parallelism needs through fused kernels (the topic of the earlier article).
Loading the 1.56 TB took 59 minutes on our machine the first time, and the server answered its first request after 64 minutes. With the checkpoint in the host’s page cache, later starts took 5 to 20 minutes. Either way, we can’t start a server only when the load arrives.
2.2 Sizing the Pools#
--mem-fraction-static 0.85 reserves 15% of each GPU outside the two pools, for activations, buffers, and the kernels’ workspaces. After startup, nvidia-smi showed 232 GiB per GPU: 195 of weights, about 30 of pools, and a remainder the log doesn’t itemize. The ratio of 1.1 divides the pools into 303 state blocks and room for 561,728 tokens.
With 5 blocks per request, 303 blocks admit 60 requests at a time. The server’s log says so, with mamba for the state and slot for a block:
max_running_requests is capped to 60 by the mamba state cache
(max_mamba_cache_size=303, 5 state slots per request).
This line is easy to miss, but it states the server’s real concurrency limit, however high we set --max-running-requests.
The cache pool holds 66 of our fresh requests, but only 4 sessions of 128,000 tokens. For long sessions, this split is wrong, and so is the way the server stores the cache. The second recipe changes that.
2.3 Low-Latency or Balanced#
The cookbook calls the recipe above Low-Latency. The other one, Balanced, adds a single flag and changes the ratio:
sglang serve --model-path moonshotai/Kimi-K3 --trust-remote-code \
  --tp-size 8 --dcp-size 8 --mem-fraction-static 0.85 \
  --reasoning-parser kimi_k3 --tool-call-parser kimi_k3 \
  --mamba-full-memory-ratio 8.82
--dcp-size 8 turns on decode context parallelism for the 24 MLA layers: each token’s cache entry is stored on one of the 8 GPUs instead of on all, which I will call a striped cache. The price is one extra exchange between the GPUs in every MLA layer of a decode step. The KDA layers are not affected, because their state has nothing to stripe.
With the cache costing an eighth per token, the calculator moves most of the memory to the state pool, which is why the ratio jumps from 1.1 to 8.82. On our server, the Balanced recipe admitted 101 requests instead of 60 and held 936,448 tokens instead of 561,728.
On top of Balanced, the cookbook offers speculative decoding with a drafter, a small model trained for K3 (DSPARK). It proposes 7 tokens, and K3 verifies them in one pass:
  --speculative-algorithm DSPARK --speculative-draft-model-path RadixArk/Kimi-K3-DSpark \
  --speculative-dspark-block-size 7 --enable-linear-replayssm-spec \
  --mamba-full-memory-ratio 6.28 --max-running-requests 256
The drafter keeps its own cache, which is not striped, so the calculator’s ratio changes again, while --enable-linear-replayssm-spec keeps the D of section 1.3 at zero. SGLang’s default with speculation is 48 running requests; the command’s 256 leaves the limit to the state pool. This server admitted 68 requests and held 697,856 tokens. (The cookbook reports the same 101 and 68.)
I ran the agent requests from section 1.4 against all three servers, and Figure 4 shows what the stripe and the drafter cost or gain.
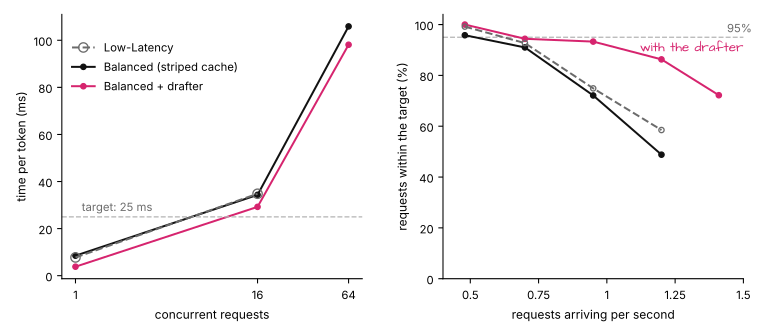
Let’s start with a single request, on the left side of Figure 4. Without the drafter, a token takes 7.7 ms with the Low-Latency recipe and 8.5 ms with the striped cache, so the stripe costs about 10%. With the drafter, it takes 3.8 ms, or 260 tokens per second. The first token arrives after about 0.44 seconds in all three.
The cookbook pins the accept length (tokens gained per verify pass) at 4.5 through an environment variable. On our agent requests, sampled at temperature 1.0, the server reported 2.7 in the run for Figure 4’s left side and 3.7 to 3.8 in the two runs for its right side. I haven’t looked into the difference.
With 16 or 64 requests at once, the recipes move close together, and at 64 the server completes about 2 requests per second. At 8,400 tokens each, that is roughly 17,000 prompt tokens per second. For this traffic, a short answer after a long prompt, the server is mostly limited by prefill, and the drafter adds 12% at 64 requests.
For the right side of Figure 4, I started each server again and let requests arrive for 4 minutes per point. At one request every 2 seconds, 99% of the requests meet the target on the Low-Latency server and 96% on the Balanced one. At 0.7 requests per second, it is 93% and 91%, and at 0.95, only 75% and 72%. With the drafter, all requests meet it at one every 2 seconds, 94% at 0.7, 93% at 0.95, and 86% still at 1.2.
Read strictly, the sustained rate is between 0.5 and 0.7 requests per second for all three recipes. What the drafter changes is how the server degrades above that: it stays within 2 points of 95% up to almost 1. Without the drafter, from 0.95 up, most misses are streams below 40 tokens per second. The drafter removes most of those, and what is left is split between slow streams and first tokens that waited behind other prompts. Each point is one run, so I wouldn’t read much into a difference of 2 or 3 points. But the gap between the 2 requests per second the server can process and what it serves within the target is clear.
Finally, I started 4 sessions at once, each with a history of about 118,000 tokens, and then sent 3 returning turns per session. The first pass took 24.2 seconds, a calculated 19,400 tokens per second. Then a returning turn got its first token after 0.45 seconds and ran at 11 to 15 ms per token, with or without the stripe. With 8 sessions on the Balanced server, about 970,000 tokens, more than its cache pool holds, the returning turns took 6 seconds to the first token, presumably because the server kept evicting one session to make room for another.
This is the bet from section 1.3 at work. At the calculator’s ratio for requests of 9,216 tokens, the Balanced server holds only 7 long sessions, because most of what the stripe freed went to the state pool. For a server that mainly holds long sessions, I would compute the ratio for their length (0.63 for 128,000 tokens, 0.45 with the drafter) and accept that fewer requests can run at once.
Which recipe would I launch? Balanced with the drafter. The stripe costs a few points below 1 request per second (10 at 1.2), and only the drafter raises the share of requests within the target. I would set the ratio from the traffic and watch the accept length. Memory is tight: the Balanced server peaked at 259 GiB of 268.6, and at 263 with the drafter.
2.4 Why Not Split Prefill and Decoding Here#
At rack scale, prefill and decoding usually get separate servers. Here, that’s not an option: two 4-GPU servers can’t each hold a copy of the weights.
What one server pays for doing both is still worth measuring, because that’s the cost a split removes. I let 16 requests decode and, after a quiet period, sent one prompt per second for 24 seconds, each asking for one token. Figure 5 shows what happened to the 16 streams.
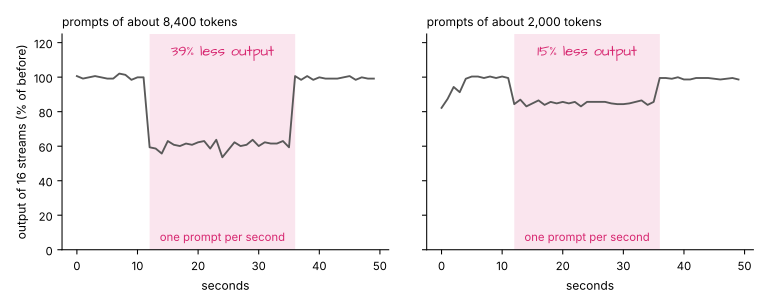
In Figure 5, with prompts of about 8,400 tokens, the streams lost 39% of their output during the window, and 31% in a second run that isn’t drawn, so roughly a third. With prompts cut to about 2,000 tokens, the size a returning turn adds, they lost 15%, in one run.
This partly explains the right side of Figure 4. At one request per second, every decoding stream shares the GPUs with a prompt about 40% of the time, since each took 0.42 seconds to prefill.
2.5 Summary#
To summarize, on 8 B300 GPUs the weights decide the layout: one tensor-parallel server whose bar shows 195 GiB of weights and 30 GiB in the two pools. A striped cache makes a cache entry 8 times cheaper at 10% more time per token for a single request, and a drafter halves that time. With long prompts and short answers, the server is mostly limited by prefill, near 2 requests per second. Its sustained rate is between 0.5 and 0.7 requests per second, and with the drafter it stays within 2 points of 95% up to almost 1. This size can’t split prefill from decoding, which costs the decoding streams about a third of their throughput at one fresh prompt per second.
3. Thirty-Two H200 GPUs: One Wide Expert-Parallel Domain#
Let’s say we have four servers instead of one. The obvious thing would be to launch the server from section 2 four times. On smaller GPUs, that’s not possible, and people run a different shape: one SGLang server across all 32 GPUs, with the experts spread 32 ways. I will call the GPUs that share one copy of the experts a domain.
The cookbook mentions a 64-GPU sweep, but 32 GPUs is the widest K3 run I found posted with a recipe.
3.1 Why Wider#
An H200 is a Hopper GPU with a nominal 141 GB of memory, which I take as decimal: 131 GiB. If we redo the bar from section 2.1 for it, four copies of the 8-GPU server are out, since each GPU would need 192 GiB. With 16 GPUs, the weights still take up 102 GiB per GPU, which fits but leaves little for the two pools. The cookbook’s basic H200 recipe is 16 GPUs wide. With 32 GPUs, each GPU holds 57 GiB of weights, as Figure 6 shows, and almost half the card is left for state and cache.
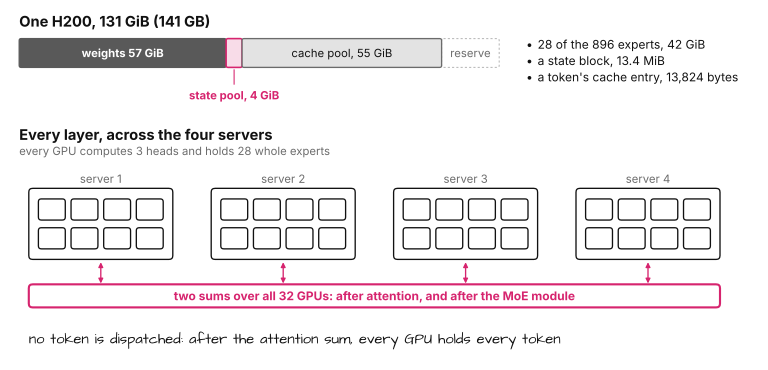
The width in Figure 6 comes from the weights. To cut the experts 32 ways, we can give every GPU a slice of every expert, as tensor parallelism does, or 28 whole experts, which is expert parallelism.
Both cuts cost the same memory, and a decode step reads the same weights either way. The cookbook’s recipe for this size uses whole experts, and so do I.
3.2 The Command#
Below is the command I use on four servers with 8 H200 GPUs each. It selects no dispatch backend to send tokens to their experts, and section 3.3 says why:
python -m sglang.launch_server \
    --model-path moonshotai/Kimi-K3 \
    --tokenizer-path moonshotai/Kimi-K3 \
    --served-model-name kimi-k3 \
    --tensor-parallel-size 32 \
    --ep-size 32 \
    --nnodes 4 \
    --node-rank "$NODE_RANK" \
    --dist-init-addr "$MASTER_ADDR:20000" \
    --dist-timeout 3600 \
    --kv-cache-dtype fp8_e4m3 \
    --mem-fraction-static 0.88 \
    --max-running-requests 64 \
    --mamba-full-memory-ratio 0.08 \
    --mamba-radix-cache-strategy extra_buffer_lazy \
    --decode-attention-backend flashmla \
    --moe-runner-backend marlin \
    --reasoning-parser kimi_k3 \
    --tool-call-parser kimi_k3 \
    --trust-remote-code \
    --enable-metrics
--kv-cache-dtype fp8_e4m3 stores the MLA cache in 8 bits and halves the cost of a token to 13,824 bytes. This matters more here than on 8 GPUs, since --tensor-parallel-size 32 makes attention 32 GPUs wide, and tensor parallelism stores the MLA cache on each of them. A session with 128,000 tokens costs 1.6 GiB on each of the 32 GPUs.
The state gets cheaper with the width, though. With 96 heads on 32 GPUs, each GPU computes 3 heads, so a state block shrinks from 53.6 MiB to 13.4 MiB. --mamba-radix-cache-strategy extra_buffer_lazy also lowers the number of blocks per request from 5 to 4 by creating one of the copies only when needed.
Both shrink the state’s share, so --mamba-full-memory-ratio is as low as 0.08. In the formula from section 1.3, this ratio corresponds to requests of about 51,000 tokens. By my arithmetic, the cache pool holds about 80 requests of that length, or 33 of our 128,000-token sessions. As a rough check, the cookbook’s run of this shape, with the drafter, a 16-bit cache, and a 10% reserve, had room for 1,940,352 tokens. That is 50 GiB per GPU before the drafter’s cache, next to the 55 GiB cache pool in Figure 6.
--max-running-requests 64 caps the batch at a number I chose. The state pool would admit about 80.
--mem-fraction-static 0.88 keeps 12% of each GPU outside the pools. Most remaining flags follow the cookbook’s High-Throughput recipe for H200, which has the same shape. flashmla and marlin are the kernels it uses on Hopper for MLA decoding and for the 4-bit experts.
3.3 What the Servers Exchange#
With expert parallelism, a dispatch backend usually sends each token to the GPUs that hold its experts. Here, that step isn’t needed.
Since attention is tensor-parallel over all 32 GPUs, its partial results are summed across all of them. Afterward, every GPU holds the hidden states of every token. Each GPU then runs its own 28 experts on the tokens routed to them, and the outputs are summed across the GPUs again. In every layer, the four servers exchange two sums, one after the attention module and one after the MoE module, as shown at the bottom of Figure 6. The second also covers the 2 shared experts, which every token uses and which are still sliced 32 ways.
With 93 layers, that’s 186 sums per decode step across the network. They are plain sums, since the fused ones from section 2.1 aren’t enabled on Hopper by default. In a decode step with 64 requests, I calculate that one sum carries about 1 MB, so the cost is the latency of 186 sums and not their bandwidth. During prefill, one sum for a chunk of 8,192 tokens (the default on this card) carries more than 100 MB by the same calculation, and that’s where I would expect this shape to hurt.
Why not keep attention in four groups of 8, one per server, and let only the experts span the servers, as section 4.4 does? A GPU then holds only its own group’s tokens. To reach experts on other GPUs, tokens need a dispatch backend, which by default copies the shared experts to every GPU, or the whole batch has to be copied to every GPU in every layer. On H200, with a plain network between servers, I use the simpler shape.
3.4 What Changes on Blackwell#
On B300 and GB300 GPUs, a different MoE path becomes attractive. MegaMoE is a fused kernel that both sends tokens to their experts and runs them. The cookbook’s presets for 16 to 64 Blackwell GPUs are built on it, together with DP attention.
There is a catch at 32 GPUs. The kernel reaches the other GPUs through memory mapped over NVLink, so all the GPUs that share the experts have to be connected by NVLink, in one NVLink domain. An open issue documents what happens otherwise on Hopper. Across two H200 servers, the kernel fails at the first token, and nothing warns about it at startup. A B300 server is also its own NVLink domain with 8 GPUs, so I would expect the same for four of them, though the report covers only Hopper.
(The cookbook implies the opposite, because it prints its preset for four B200 or B300 servers. I couldn’t find a posted run of it.)
On a GB300 system, where the NVLink domain spans many nodes, a 32-GPU domain with the fused kernel is possible, and there is one public report of it in production-like use. Unfortunately, it’s a bug report. On a coding benchmark, K3 solved 68% of the tasks with tensor parallelism over 8 GPUs, about 65.5% with expert parallelism over 32 GPUs and an unfused backend, and 42% with the fused kernel over 32 GPUs. The fused run was a decode server with attention in eight groups of 4, unlike section 4.4’s four groups of 8, and half its outputs ran into long repetitions. In that build, the loss follows the fused kernel, not the width, since the unfused run at the same width was close to the baseline. The reporter hasn’t found the cause.
3.5 Summary#
To summarize, the answer at 32 GPUs depends on the hardware. On H200, memory forces the width, which shrinks the weights in the bar to 57 GiB, and the price is two sums per layer across the network. On four B300 servers, I would run the server from section 2 four times, because the fused MoE kernel probably can’t cross between servers. The wide shape becomes interesting on Blackwell only once the NVLink domain is larger than a server.
4. A GB300 Rack: A Prefill Pool and a Decode Pool#
A GB300 NVL72 has 72 GPUs and 20 TB of GPU memory, in nodes of 4 GPUs, and all of it is one NVLink domain. For K3, this means room for nine groups of 8 GPUs, each with its own copy of the weights. The limit from section 3.4 is gone too, since the fused MoE kernel can reach any GPU in the rack.
4.1 Three Ways to Fill a Rack#
With nine groups, we can finally give prefill and decoding their own GPUs (prefill-decode disaggregation), which should remove the cost we measured in section 2.4. I see three ways to use the rack:
- (a) Nine unified servers: the server from section 2, nine times, behind a load balancer. This is the baseline.
- (b) A prefill pool and independent 8-GPU decode servers: some groups only prefill, the others only decode, with a router in front and the request’s state transferred in between. This layout has measurements behind it.
- (c) A prefill pool and one or two wide decode domains: the same split, but the decode side is a single server over 32 or 64 GPUs with the experts spread across all of them. This is a proposal.
The K3 recipes of the open InferenceX benchmark are for other engines and stop at 32 GPUs: a prefill worker and three 8-GPU decode servers, which is layout (b).
4.2 The Prefill Pool#
Layouts (b) and (c) share the prefill side. For this role, the cookbook’s Long-Context recipe is what it calls deep pipeline parallelism: no tensor parallelism and one pipeline stage per GPU. With 8 GPUs, each stage holds 11 or 12 of the 93 layers in full, and a prompt moves through the stages chunk by chunk.
# prefill worker: 8 GPUs on two nodes (from the cookbook's GB300 Long-Context prefill recipe)
sglang serve --model-path moonshotai/Kimi-K3 --trust-remote-code \
  --tp-size 1 --pp-size 8 --nnodes 2 --node-rank <rank> --dist-init-addr <node0-ip>:20000 \
  --chunked-prefill-size 16384 --max-prefill-tokens 16384 \
  --mem-fraction-static 0.90 --mamba-full-memory-ratio <from the calculator> \
  --disaggregation-mode prefill --disaggregation-transfer-backend nixl \
  --reasoning-parser kimi_k3 --tool-call-parser kimi_k3 \
  --disaggregation-bootstrap-port 8998 --host 0.0.0.0 --port 30000
Prefill is about throughput, which a pipeline is built for. The usual way to speed up a long prefill is prefill context parallelism, which deals the prompt’s tokens out to the GPUs. SGLang has no such path for K3, whose 69 KDA layers fold the tokens into their state in order. Cutting the model by layer is what remains.
The SGLang post about Kimi K3 measured this on two GB300 nodes with 8,000-token prompts. With several prompts at once (the crossover is between 1 and 4), the pipeline reaches 1.45 to 1.72 times the prefill throughput of an 8-GPU tensor-parallel worker with expert parallelism.
But an open issue reports 31 seconds to the first token with this prefill shape, against 2.3 seconds with a tensor-parallel prefill worker, for long sessions, both measured on one pair of B300 servers, one per role. The issue calls this comparison not perfectly controlled. In a saturated test, it measured only 1.10 times the prefill throughput of the tensor-parallel worker. A partial fix was merged after the commit I use. Until the issue closes, I would start the pool with the cookbook’s tensor-parallel Default prefill recipe for 8 GPUs and switch once the pipeline’s first-token time is measured.
4.3 Decode Servers of 8 GPUs#
In layout (b), a decode server is the Balanced server from section 2.3 in a different role:
# decode server: 8 GPUs on two nodes (the cookbook's GB300 Balanced decode recipe)
sglang serve --model-path moonshotai/Kimi-K3 --trust-remote-code \
  --tp-size 8 --dcp-size 8 --nnodes 2 --node-rank <rank> --dist-init-addr <node0-ip>:20000 \
  --mem-fraction-static 0.85 --mamba-full-memory-ratio <from the calculator> \
  --disaggregation-mode decode --disaggregation-transfer-backend nixl \
  --disaggregation-decode-extra-slots 16 \
  --reasoning-parser kimi_k3 --tool-call-parser kimi_k3 --host 0.0.0.0 --port 30100
Unlike the unified server, a decode role doesn’t cache prefixes, so a request holds 1 state block, not 5. That’s why the calculator gives this role a much smaller ratio. Requests still in transfer already hold a block, so the server needs a few more blocks than running requests. SGLang adds them only when --max-running-requests is set to 32 or less, so the cookbook sets --disaggregation-decode-extra-slots.
The fused sums, the striped cache, and the drafter carry over from section 2, though no shipped recipe runs the drafter behind a pipeline prefill.
The post from section 4.2 measured this layout. With one decode server per pipeline prefill worker, it reports its highest throughput: 2,808 tokens per second per GPU with an unstriped decode server, and 2,633 with striped ones. With one prefill worker feeding two, three, and four decode servers, the reported throughput per GPU drops and the speed of a single stream rises to more than 116 tokens per second. For these points, the post doesn’t name the hardware (its other measurements ran on GB300 nodes), the request shape, how it counts tokens, or whether the drafter was on.
4.4 Wide Decode Domains#
Layout (c) replaces the separate decode servers with what the cookbook’s large-scale presets describe: one server over 32 or 64 GPUs that spreads the experts over all of them with the fused kernel from section 3.4. Attention stays in tensor-parallel groups of 8 that each serve their share of the requests (DP attention: --attn-dp-size 4 or 8 splits --tp-size into that many groups).
The attraction is the memory bar. Figure 7 shows it for the three roles.
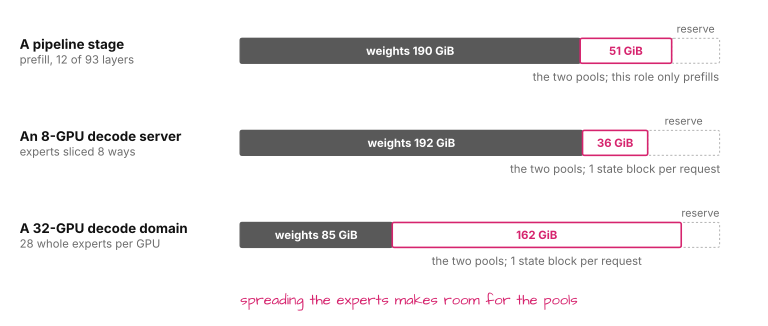
In Figure 7, spreading the experts over 32 GPUs shrinks the weights from 192 GiB to 85 GiB per GPU, even though the preset stores the shared experts in full on every GPU. With 64 GPUs, I calculate 64 GiB. The pools grow by a factor of 4 or more.
Why does attention stay in groups of 8 instead of one group per GPU, as usual with DP attention? With one group per GPU, every GPU would hold all 67 GiB of attention weights instead of its 9 GiB share, and SGLang’s fused KDA decode kernel is compiled only for a width of 8.
The price is on the cache side: inside a group of 8, the MLA cache is stored 8 times. The presets’ two variants differ here. Peak Throughput leaves the cache replicated and stores it in 8 bits. Peak Capacity adds the striped cache inside each group, which, according to the cookbook, fits 72% more requests at about 1.8 times the time per token. The cookbook doesn’t say why that is so much more than our 10%. In the first variant, a token costs 4 times as much per GPU as in the striped server of layout (b). Not counting the fused kernel’s buffer, I calculate that the larger pools hold about as many tokens per GPU as that server.
Below is a 32-GPU decode domain in the first variant. I wrote this command myself: the cookbook offers the preset for unified servers, and its only decode recipe of this kind is 16 GPUs wide and striped. The nearest thing that has run is the 32-GPU decode server from the bug report in section 3.4.
# decode domain: 32 GPUs on eight nodes (the cookbook's Peak Throughput preset as a decode role)
SGLANG_OPT_DEEPGEMM_MEGA_MOE_NUM_MAX_TOKENS_PER_RANK=20480 \
sglang serve --model-path moonshotai/Kimi-K3 --trust-remote-code \
  --tp-size 32 --ep-size 32 --attn-dp-size 4 --enable-dp-lm-head \
  --nnodes 8 --node-rank <rank> --dist-init-addr <node0-ip>:20000 \
  --moe-a2a-backend megamoe --moe-runner-backend deep_gemm \
  --kv-cache-dtype fp8_e4m3 --mamba-ssm-dtype bfloat16 \
  --mem-fraction-static 0.92 --mamba-full-memory-ratio <from the calculator> \
  --disaggregation-mode decode --disaggregation-transfer-backend nixl \
  --disaggregation-decode-extra-slots 16 \
  --reasoning-parser kimi_k3 --tool-call-parser kimi_k3 --host 0.0.0.0 --port 30100
SGLang checks the cache format when the two roles connect, and I would keep the state format equal too, so the prefill worker from section 4.2 would need the same --kv-cache-dtype and --mamba-ssm-dtype flags.
Before choosing this layout over (b), I would check that:
- The fused kernel keeps the accuracy. In the bug report from section 3.4, it lost 26 points on a coding benchmark over 32 GPUs, against tensor parallelism over 8.
- The attention groups stay fast: with a dispatch backend, SGLang replaces section 2.1’s fused sums with another fused exchange, tuned for GB200 and GB300 groups.
- The drafter works here: it has been validated together with expert parallelism and DP attention only on 8 GPUs.
- The larger failure domain is worth its cost: a domain is one server, so a single fault or restart takes down 32 or 64 GPUs, and all its attention groups have to take every step together.
- A clean public run exists. Today, the cookbook itself says: “No preset has a full serving round on final weights.”
The variable before the command caps the fused kernel’s tokens per GPU. For this checkpoint, the cap is checked only at run time.
4.5 What Crosses Between the Roles#
With two kinds of servers, a request takes the path that Figure 8 shows.
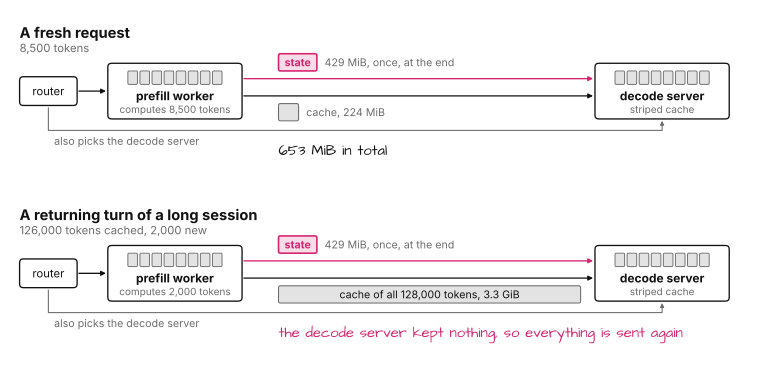
In Figure 8, the router picks a prefill worker and a decode server. The decode server reserves a state block and cache pages, the prefill worker computes the prompt, and the result is transferred from GPU to GPU. This is the router:
python3 -m sglang_router.launch_router --pd-disaggregation \
  --prefill http://<prefill-host>:30000 8998 \
  --decode http://<decode-host>:30100 \
  --host 0.0.0.0 --port 8000
The transfer moves both kinds of state. The state of the request is sent once, at the end, and always has the same size: 429 MiB with the default 32-bit state. The MLA cache entries are sent as the chunks finish and grow with the prompt: 224 MiB for our fresh request. Before sending, the prefill worker picks out every eighth token for each of the 8 GPUs, so a decode server with a striped cache needs only one copy of them.
How fast is that? The issue from section 4.2 logs 4 GB/s from a tensor-parallel prefill worker to an unstriped decode server, on two B300 servers with the Mooncake transfer backend over RDMA. In the tree I read, SGLang computes that rate per prefill GPU, and all 8 send at once. A fresh request’s 653 MiB (429 state, 224 striped cache) are 82 MiB per GPU, 0.02 seconds by my arithmetic, if the striped path reaches that rate, which the issue didn’t measure. With the pipeline prefill, the same report measured only 0.02 GB/s, which is part of the bug. I have no rate for NIXL, the transfer backend the cookbook’s recipes use, or for Mooncake’s NVLink mode, which the documentation recommends for NVL72.
The transfer that grows is the returning turn of a long session. By default, a decode role keeps nothing once a request finishes, while the prefill worker has the prefix in its cache. For the next turn of a 128,000-token session, it computes only the 2,000 new tokens but sends the cache entries of all 128,000 again. With the striped decode servers of layout (b), that’s 3.3 GiB in total plus the state, 0.5 GiB per GPU, or about 0.1 seconds at 4 GB/s per GPU. With the unstriped domain of layout (c), it is 8 copies of an 8-bit cache, 13 GiB, but each GPU receives only its own 1.6 GiB, in under half a second. At that rate, transfer rules out no layout. If the issue’s 4 GB/s is a sum over the 8 GPUs, these times are 8 times longer.
End to end, the long sessions of the issue’s tensor-parallel baseline (a median of 56,903 input tokens, 95.5% prefix hits) still waited a median of 2.3 seconds for the first token. SGLang’s prefix cache for decode servers, behind a flag, would avoid the resend, but it is marked experimental and not available with a striped cache, so it doesn’t help layout (b).
Routing matters too, because the prefix of a returning turn lives on a prefill worker. With more than one prefill worker, the router has to send a session back to the worker that holds it, by a session key from the client or by its cache-aware policy. The pool’s cache also limits how many sessions stay warm: if the 30 GiB of pools per GPU from section 2.2 all held cache, a tensor-parallel worker would keep at most 9 sessions of 128,000 tokens.
4.6 Seventy-Two GPUs, Compared#
To compare the three layouts, I use requests with 8,192 prompt tokens and 1,024 output tokens, since numbers exist for that shape. Figure 9 shows the layouts.
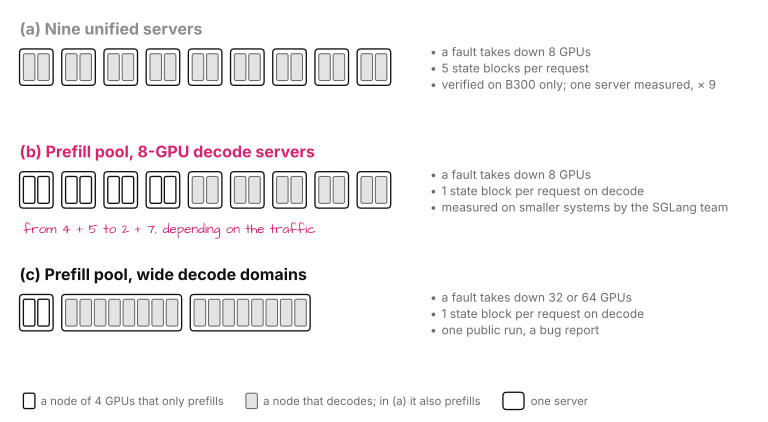
For the baseline (a) in Figure 9, I multiply one B300 server by nine. For these requests, the cookbook’s verified number for Balanced at 64 concurrent requests is 1,395 tokens per second per GPU, a calculated 155 of them output. That is 1.2 requests per second per server and 11 for nine, at a reported 40 ms per token and more than 11 seconds to the first token. (The cookbook’s 1,987 with the drafter, at a pinned accept length, gives about 16 for nine servers, at 24 ms per token.) Throughput isn’t the baseline’s problem, but that first token is far outside our target. On our agent requests in section 2.3, a server with the drafter met the target up to 0.5 to 0.7 requests per second, which is 4.5 to 6.3 for the rack.
What can layout (b) add? Its measured knob is the ratio of prefill workers to decode servers, between 1 to 1 for the highest throughput and 1 to 4 for the fastest streams. Extrapolated to nine groups, that means anything from four pipeline prefill workers and five decode servers to two and seven. For four pairs without the ninth group, the post’s 2,633 gives 18 requests per second, if the post used this request shape and, like the cookbook, counts input and output tokens over all GPUs. That rate, tokens per second per GPU at 1 to 1 with striped decode servers, is 1.9 times the cookbook’s 1,395 for the unified Balanced server, or 1.3 times its number with the drafter. I wouldn’t read anything into either. What a split should add is what the baseline can’t provide: decoding streams that don’t stall for a prompt. Its first tokens still queue behind other prompts.
For layout (c), the only per-GPU rates the cookbook gives for prefill and decode roles are for 16-GPU shapes on GB200 that it marks as not yet verified, mostly at loads far from our target. Sized from those borrowed rates (4,550 prompt tokens per second per prefill GPU, 145 output tokens per decode GPU), Figure 9’s split of 8 prefill GPUs in front of 64 gives about 4 requests per second, limited by prefill. With 16 and 56, I calculate about 8, limited by decoding. Both are below the baseline’s 11. Layout (c)‘s advantage would have to come from memory, from more requests running at once, which these rates don’t measure.
Which one would I launch? For traffic with fresh prompts, layout (b). It’s a split, it reuses the 8-GPU recipe in unverified roles, and the SGLang team has measured its ratio. For traffic like ours, which section 2.3 showed is mostly limited by prefill, I would aim for four pipeline prefill workers and five decode servers, and for long answers, two and seven. As long as the pool is tensor-parallel (section 4.2), with the 1.45 to 1.72 times lower prefill throughput of the post’s worker, I calculate five prefill workers and four decode servers, or three and six for long answers. For mostly cached prompts, what sets the number of prefill workers is the prefixes they have to keep, not the tokens they compute.
Layout (c) is the one I would measure next, against the list in section 4.4, because the rack’s NVLink domain lets the fused kernel span 32 GPUs.
For long agent sessions, I would stay with unified servers as long as the sessions fit in their cache pool. Ours gave a returning turn its first token in 0.45 seconds with 4 sessions, and took 6 seconds only once 8 sessions overflowed the pool. The only split measured on long sessions, the issue’s, had a median first token of 2.3 seconds, but at 20 concurrent sessions, a load we didn’t put on ours.
I would bring a rack up in order of evidence: unified servers first, whose recipe is verified on B300, then one prefill worker in front of one decode server, measuring first-token time and transfer rate. Only then would I add groups. A group that restarts is gone for 5 to 20 minutes, or an hour with a cold page cache, and a restarted prefill worker has lost its prefixes.
When more requests arrive than the rack can serve, a decode server without the drafter keeps admitting them, because by my arithmetic its state pool holds a few hundred. Every stream then slows down, while first tokens wait on the prefill side. Neither decode command sets --max-running-requests. When set, this flag, not the ratio, sizes a decode role’s state pool and caps the batch (the drafter sets it to 48). The queue lengths on both sides and the state and cache pool usage, which SGLang exports as metrics, are the first numbers I would put on a dashboard.
4.7 Summary#
To summarize, the rack removes the two limits that shaped the smaller deployments: the weights, because there is room for nine copies, and the network, because all 72 GPUs share one NVLink domain. For section 4.6’s requests, the cookbook’s B300 number gives 11 per second for nine unified servers, the post’s rate gives 18 for four pairs of layout (b), and borrowed GB200 rates give 4 to 8 for layout (c). For fresh prompts, I would launch layout (b): more prefill workers for long prompts with little reuse, more decode servers for long answers. At the one logged rate, the cache transfer rules out no layout.
5. What I Would Measure First#
I would measure these before committing.
- The lengths of real requests set the ratio between the two pools. If they are far from the 9,216 tokens I assumed, the ratio changes, and with it the number of requests that can run at once.
- If the drafter’s accept length on real traffic under load falls much below the 2.7 to 3.8 the server reported on agent requests, the drafter costs more memory and compute than it returns.
- The accuracy at every new width needs an evaluation with long outputs, because the 8-GPU Balanced recipe’s accuracy gate, in SGLang’s own tests, is a math benchmark, while the regression from section 3.4 showed up on long coding tasks.
- If the pipeline prefill on the actual build still needs the 31 seconds to the first token from the open issue, the prefill pool stays tensor-parallel.
- If a returning turn of a long session through a split stays within the 2 seconds on the rack, long sessions can leave the unified servers. The transfer rate alone doesn’t decide it.
- The share of each prompt that the prefill pool finds in its cache and the queues on both sides together set how many of the nine groups prefill.
6. Summary#
To wrap up, Figure 10 shows what one GPU holds in each deployment.
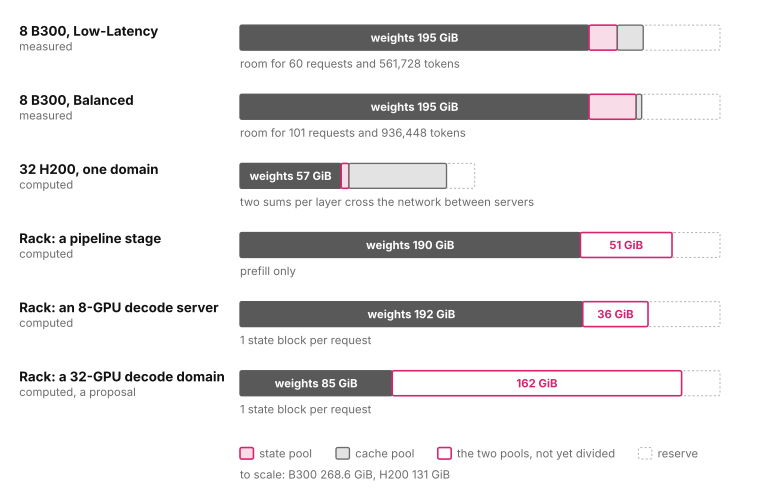
In Figure 10, the weights take up most of a GPU as long as the model is on 8 of them. Only spreading the experts over more GPUs, as in the third and the last bar, changes that.
What does a production deployment of Kimi K3 look like, then? On one server with 8 B300 GPUs, it is a single tensor-parallel server that does everything, with a striped cache and a drafter on top. On four servers with smaller GPUs, the model is spread 32 ways with whole experts on every GPU. On a rack with fresh prompts, I would have a few groups only prefill, in front of 8-GPU decode servers; whether these grow into domains of 32 or 64 GPUs depends on measurements that don’t exist yet. Long agent sessions stay on unified servers while they fit in the cache pool.
What stays the same at every size is the reason behind each choice. The experts are large and can be cut freely, so they follow the memory. The state of a request is fixed in size and expensive to keep in several copies, so a decode role, which caches no prefixes, keeps only one. One bet on the traffic divides what the weights leave free between requests and tokens.
If you fill a rack with K3, I would be glad to see the numbers.